
Mapping Emissions: Satellite-Based Insights into UAE Greenhouse Gases
Explore how satellite remote sensing data reveals greenhouse gas concentration patterns across the UAE.
1/3/20263 min read
Greenhouse gas (GHG) monitoring is a core element of the UAE’s climate and air‑quality strategy. Using Sentinel‑5P TROPOMI satellite products together with ERA5‑Land temperature data, multi‑year patterns in methane (CH₄), sulfur dioxide (SO₂), nitrogen dioxide (NO₂), and carbon monoxide (CO) can be mapped consistently across major UAE cities.
If you’re evaluating use cases, stuck at the pilot stage, or thinking about using near real time Green House Gas (GHG) data, then reach out to us at info@dimensionalanalytics.com for more insights and implementation techniques for your unique use cases.
Data and Methodology
This analysis uses Google Earth Engine to access Sentinel‑5P TROPOMI and ERA5‑Land datasets for all major UAE cities.
Sentinel‑5P TROPOMI
CH₄: column‑averaged dry air mixing ratio (ppb).
SO₂: vertical column density (mol/m²).
NO₂: total vertical column (mol/m²).
CO: vertically integrated column density (mol/m²).
ERA5‑Land
2 m air temperature, aggregated to monthly means to examine thermal and seasonal patterns.
City‑level monthly aggregates are computed to capture both spatial contrasts between cities and seasonal cycles over multiple years.
Key Findings
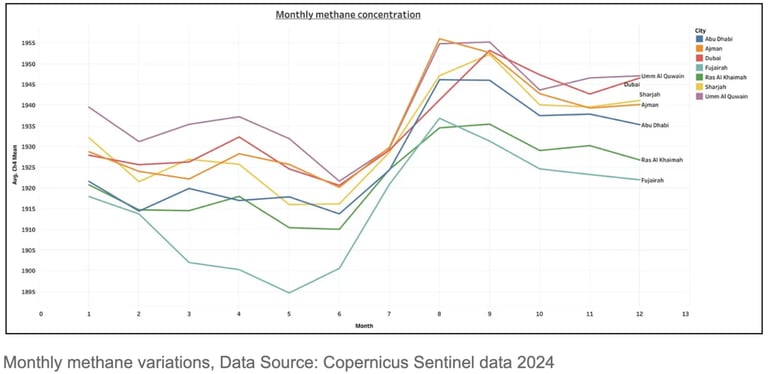
Methane concentrations show modestly elevated values over specific coastal and urban–industrial zones, with Umm Al Quwain generally higher than Dubai, Ajman, and Abu Dhabi. These patterns align with oil and gas operations, waste‑sector activity, and nearby mangrove and wetland systems, which global wetland studies identify as natural methane sources, especially in warm seasons. Seasonally, methane tends to peak in late summer to early autumn, when high soil and air temperatures promote microbial CH₄ production in saturated soils and wetlands.
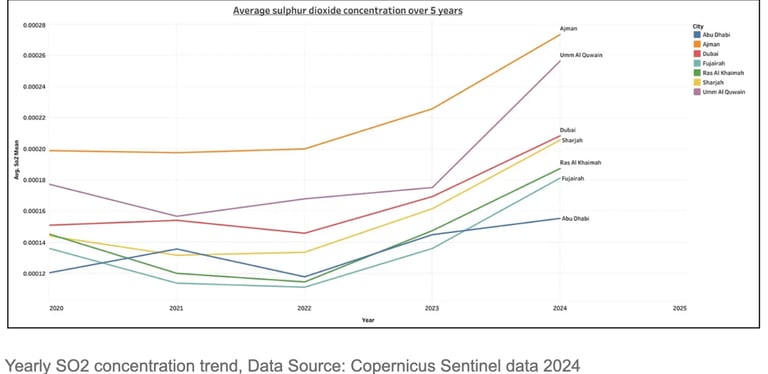
SO₂ and NO₂ show clear enhancements over urban and industrial centers relative to surrounding desert regions, echoing media and institutional work that highlight industrial belts and dense traffic corridors in the UAE as key air‑quality hotspots. SO₂ is closely tied to fossil‑fuel‑based power and industrial processes, while NO₂ mainly reflects vehicle exhaust and combustion sources, consistent with U.S. EPA descriptions. NO₂ is typically higher in cooler months and lower in peak summer, in line with greater mobility in milder weather and enhanced photochemical removal under intense summer sunlight. SO₂ often displays alternating month‑to‑month peaks and dips, likely driven by industrial operating schedules and wind‑driven dispersion.
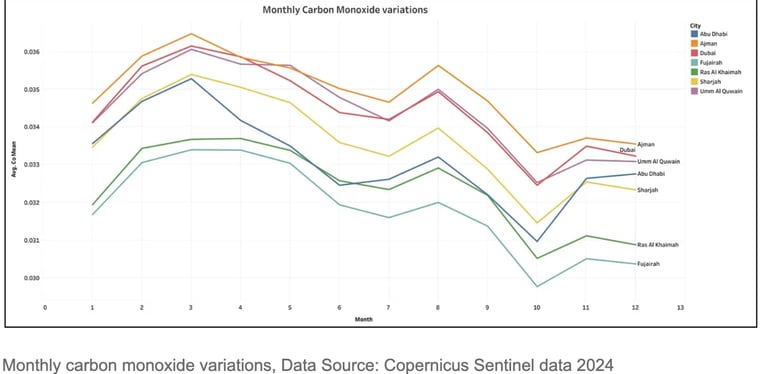
Carbon monoxide generally declines across the calendar year but shows noticeable peaks in late winter or early spring and late summer, similar to global CO behavior described in NASA explainers, where lower winter sunlight reduces hydroxyl radical (OH) and allows CO to persist longer. ERA5‑Land confirms that the UAE experiences very hot summers and mild winters, with the highest temperatures in mid‑year; these hot periods coincide with higher CH₄ and lower NO₂, underscoring the tight coupling between temperature, chemistry, and emissions.
Implications and Recommendations
Targeted Emission Reduction
Focus on cities such as Umm Al Quwain, Ajman, Dubai, and Abu Dhabi, where multi‑year satellite maps and media reports repeatedly indicate higher pollutant levels.
Prioritize methane mitigation in waste, oil and gas, and other point sources while systematically validating satellite‑detected hotspots with ground sensors.
Seasonal Monitoring and Action
Strengthen monitoring and regulatory measures during warmer months for CH₄ and SO₂ and during cooler high‑traffic months for NO₂.
Coordinate industrial maintenance, cleaner‑fuel switches, and public advisories with expected seasonal peaks, reflecting concerns highlighted in recent UAE air‑quality coverage.
Leveraging Natural Ecosystems
Preserve mangrove and blue‑carbon ecosystems for their carbon‑sequestration value while explicitly accounting for their natural methane emissions in GHG strategies.
Integrate ecological, hydrological, and satellite data to design climate‑smart coastal and wetland management plans that minimize unintended CH₄ releases.
Way Forward…
Remote sensing with Sentinel‑5P, combined with ERA5‑Land reanalysis and open tools like Google Earth Engine, offers a scalable way to track GHG‑related pollutants across UAE cities. When interpreted alongside media investigations and policy announcements on air quality and methane reduction, these data provide a strong foundation for digital MRV, hotspot detection, and future GeoAI solutions that can help the UAE implement targeted, evidence‑based emission mitigation. If you’re evaluating use cases, stuck at the pilot stage, or thinking about using near real time Green House Gas (GHG) data, then reach out to us at info@dimensionalanalytics.com for more insights and implementation techniques for your unique use cases.